Get the latest updates From BL Soni College Bhilwara
. How can graphic design be used to create visually appealing annual reports?
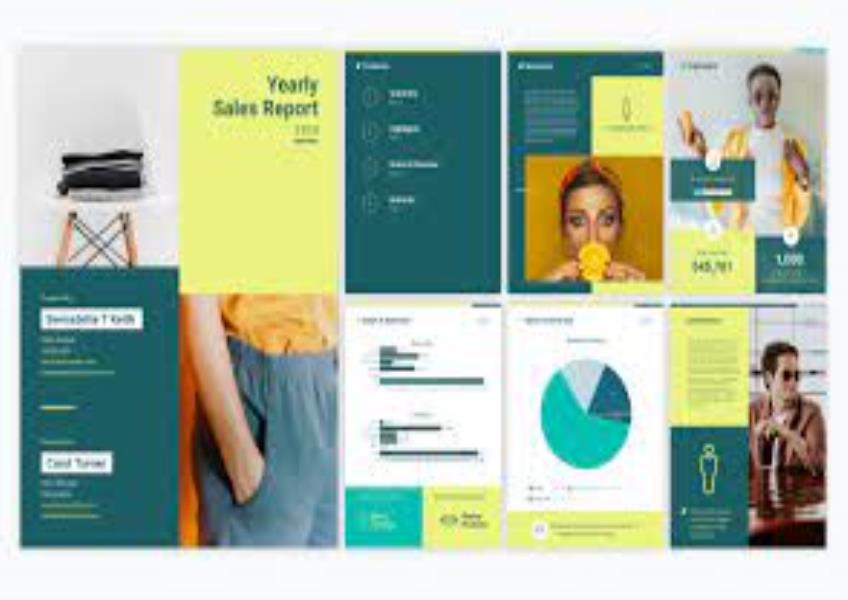
Graphic design plays a crucial role in creating visually appealing annual reports. An annual report is not just a document; it's an opportunity to convey your organization's achievements, goals, and financial information in a compelling and engaging way. Here are some ways graphic design can be used effectively in annual reports: Visual Hierarchy: Use visual hierarchy to guide readers through the report. Highlight key information such as financial summaries, achievements, and goals through the use of larger fonts, bold text, and strategic placement. Color Palette: Choose a color palette that aligns with your organization's branding and conveys the desired mood. Colors can evoke emotions and help with information organization. Typography: Select fonts that are easy to read and complement your organization's brand identity. Use different font styles and sizes to distinguish headings, subheadings, and body text. Infographics and Data Visualization: Transform complex data and statistics into visually appealing infographics, charts, and graphs. This makes the information more accessible and engaging for readers. Photography and Illustrations: Incorporate high-quality images, photographs, and illustrations that support your organization's narrative. Use visuals to showcase achievements, staff, or the impact of your work. Layout and Grids: Create a clean and well-structured layout using grids. Consistent margins, spacing, and alignment enhance readability and overall aesthetics. Icons and Icons Sets: Icons can be used to represent various sections or concepts within the report. They add visual interest and make the content more digestible. Whitespace: Embrace whitespace to avoid clutter. It provides breathing room for content and makes the report easier to navigate. Consistency: Maintain a consistent design style throughout the report. This includes using consistent colors, fonts, and formatting. Interactive Elements: In digital versions of annual reports, consider adding interactive elements like clickable links, navigation menus, and embedded videos to engage readers. Storytelling: Use design to help tell a compelling narrative about your organization's journey, achievements, and future goals. Incorporate storytelling elements like testimonials, case studies, and quotes. Print and Digital Considerations: If creating both print and digital versions, tailor the design to each format's strengths. Digital reports may include interactive features, while print versions can focus on tactile design elements. Accessibility: Ensure that the design is accessible to a wide range of readers, including those with disabilities. Use alt text for images and provide accessible document formats. Feedback and Testing: Seek feedback from stakeholders and test the design with a sample audience to ensure it effectively communicates your message and meets your audience's expectations. Professional Design Software: Consider using professional graphic design software like Adobe InDesign, Illustrator, or Canva to create visually appealing layouts and graphics. Remember that the key to a successful annual report is balancing aesthetics with clear communication. The design should enhance the content and make it more engaging and memorable for your audience.